Ol_Monitor Main window

Ol_Monitor Main window

The main display.


1 . SmileySmiley

Smiley

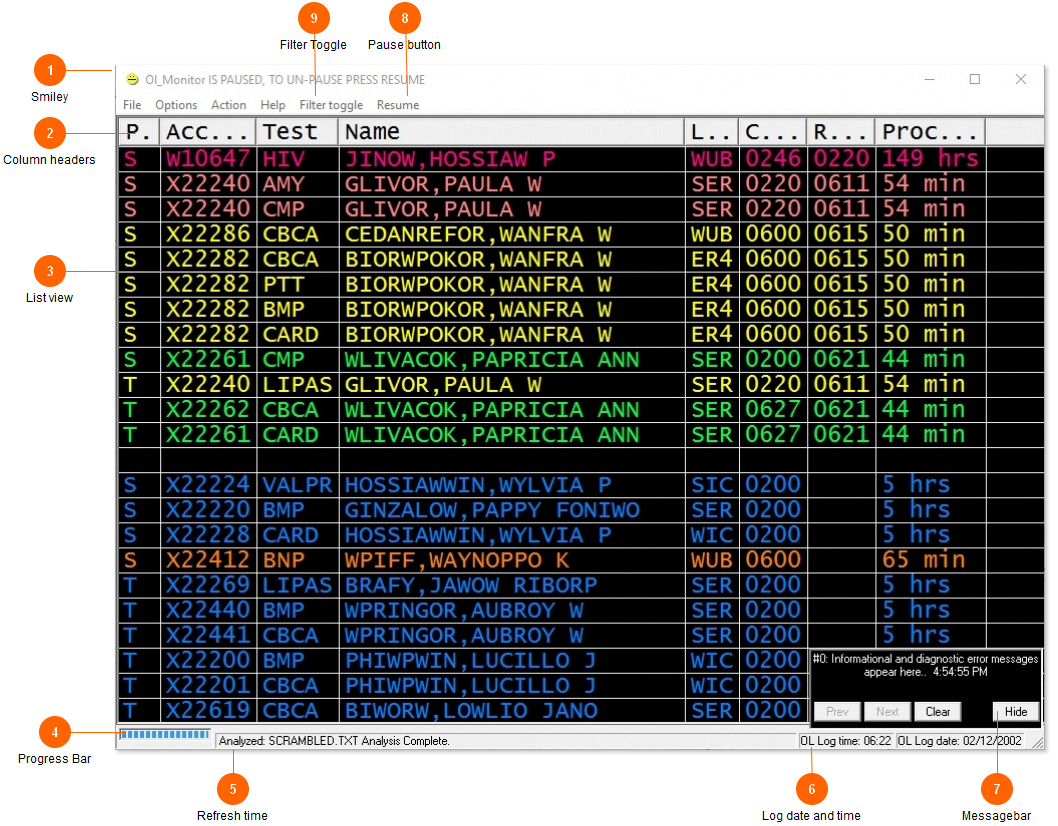
Many people have expressed confusion about the signifigance of the smiley icon.

It does not indicate in any way that the program is functioning or not functioning.


The smiley face changes expression depending on workload.

After a refresh of data, if the number of tests has increased, it will show a sad face :(

If the number of tests has decreased, it will show a happy face :)

If the number of tests stays the same, it will show an inexpressive face :|

Finally if by some miracle the log clears entirely and there are no tests to list, it will show a face with sunglasses on.

2 . Column headersColumn headers

Column headers

Column headers display the name of the field in the list below.   You can select which fields will be displayed such as Collect time, Accession, and test name.  

Note: Normally OlMonitor automatically calculates the correct size for the columns.   However you can resize the columns if you like.   After you have resized the column OlMonitor will store the column width you set and skip automatic sizing of that column.

To change the arrangement (order) of the columns, simply click and drag any column to the desired location.

NEW: Sunquest Smart information such as Batch ID number, Rack/slot etc can now also be displayed if present.

Refer to the options window help for a complete list of available fields.


3 . List viewList view

List view

The list of tests from your outstanding log are displayed here.   An extremely flexible and easy system of filtering gives you full control over what tests are displayed.   Turn-around-times can be defined for specific tests, all tests, or a combination of both.   Tests can be given different colors if they exceed the defined turn-around time.   A wave file can also be specified to sound for each TAT.  


4 . Progress BarProgress Bar

Progress Bar

The progress bar shows how much time is left until the next refresh.


5 . Refresh timeRefresh time

Refresh time

Starting with version 1.76, the refresh time is now a calculated value.   The interval between each log refresh is recorded.   Using the average of these times, the estimated time to refresh is calculated.  

To set the delay between refreshes, see the refresh time in options.

6 . Log date and timeLog date and time

Log date and time

The time and date is extracted from the current log, if it is not current, you may be looking at old information

If you are using the PL   and/or HRP module, the date and time from the PL log also appears here.

7 . MessagebarMessagebar

Messagebar

MessageBar:

The messagebar shows informational messages, errors, and messages from the macro.

Sometimes it's really important information like letting you know your password is about to expire.

Other times it's just fyi info.

You can clear the message, skip to the next message, or if you don't want it to be blocking your view you can press the hide button and it will shrink into a little box with an exclamation mark in the corner.

Once you clear all the messages the box will disappear entirely until another messagbar message comes across.

*Versions 1.89j and above: Certain messagebar messages will automatically clear after 15 minutes.

8 . Pause buttonPause button

Pause button

The pause button will suspend OL Monitors automated activities such as:

-Checking for operation of and launching Smarterm.

-Checking for new logfiles.

-Updating the ETR/Refresh time

-Playing TAT sounds.

-Auto-scrolling the display


This is useful during troubleshooting or if you're trying to scrutinize one of the tests and the display keeps scrolling and refreshing, or if Smarterm is on the fritz and you don't want it to keep getting launched.

9 . Filter ToggleFilter Toggle

Filter Toggle

This feature can quickly turn on/off individual filters from the main window. This might be useful to handle workload during different times of the day or shifts.   This feature is available in versions 1.89k and higher.

Filter toggle: http://olmonitorblog.azurewebsites.net/?p=299


Created with DrExplain